Proof of Value
Prove it on 500 meters. Free.
A Proof of Value is a guided six-step run on your own meters, at no cost, ending in a readout you can take to your team. Start one, pause it, come back — your progress is saved with the POV.
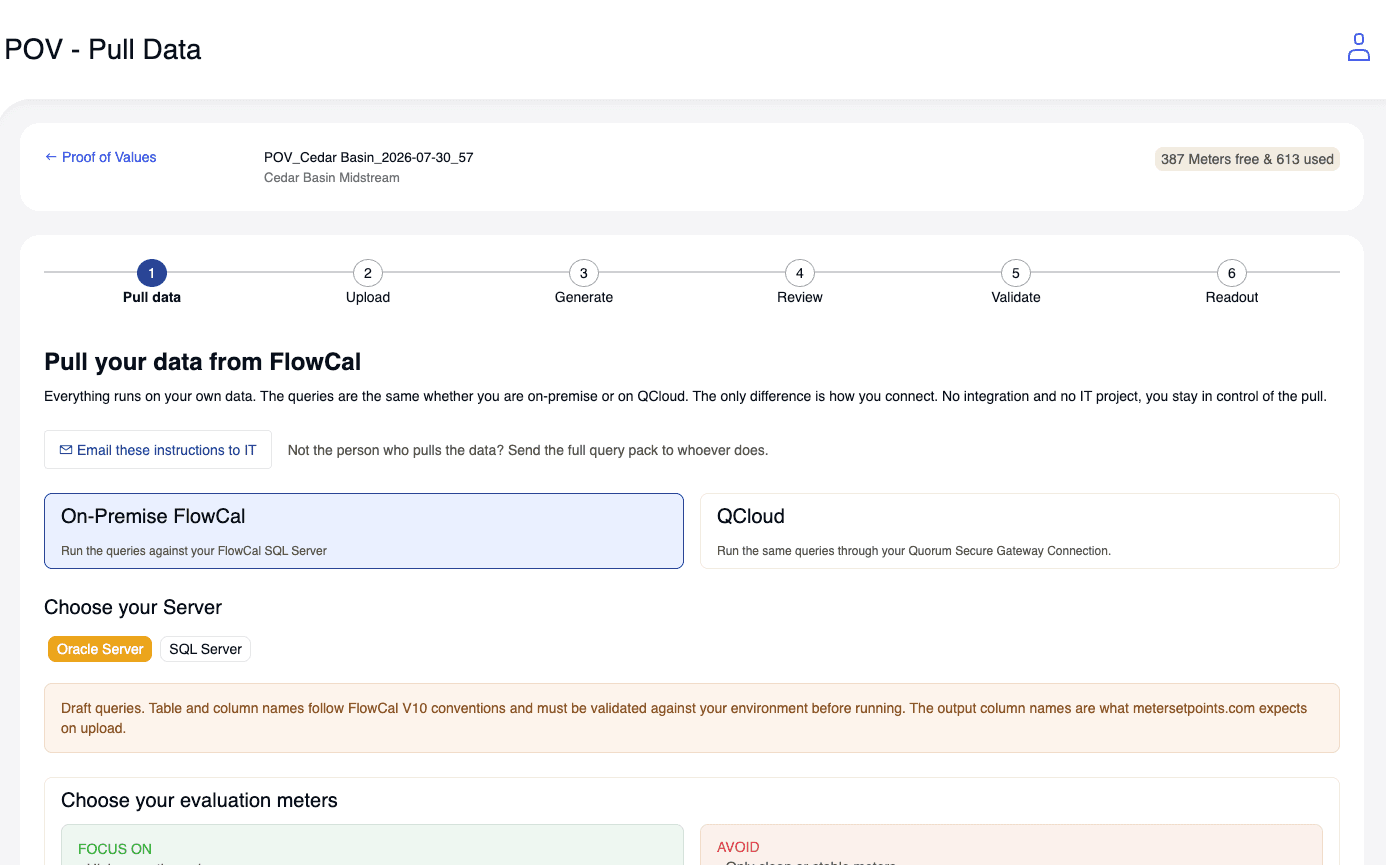
Pull data
Run our queries against your FlowCal, on-premise or QCloud.
Upload
Drop in the four files — we check them before you continue.
Generate
Setpoints and an FCLoader file, built automatically.
Review
See how your exception counts would change, meter by meter.
Validate
Resolve every flagged meter to a decision.
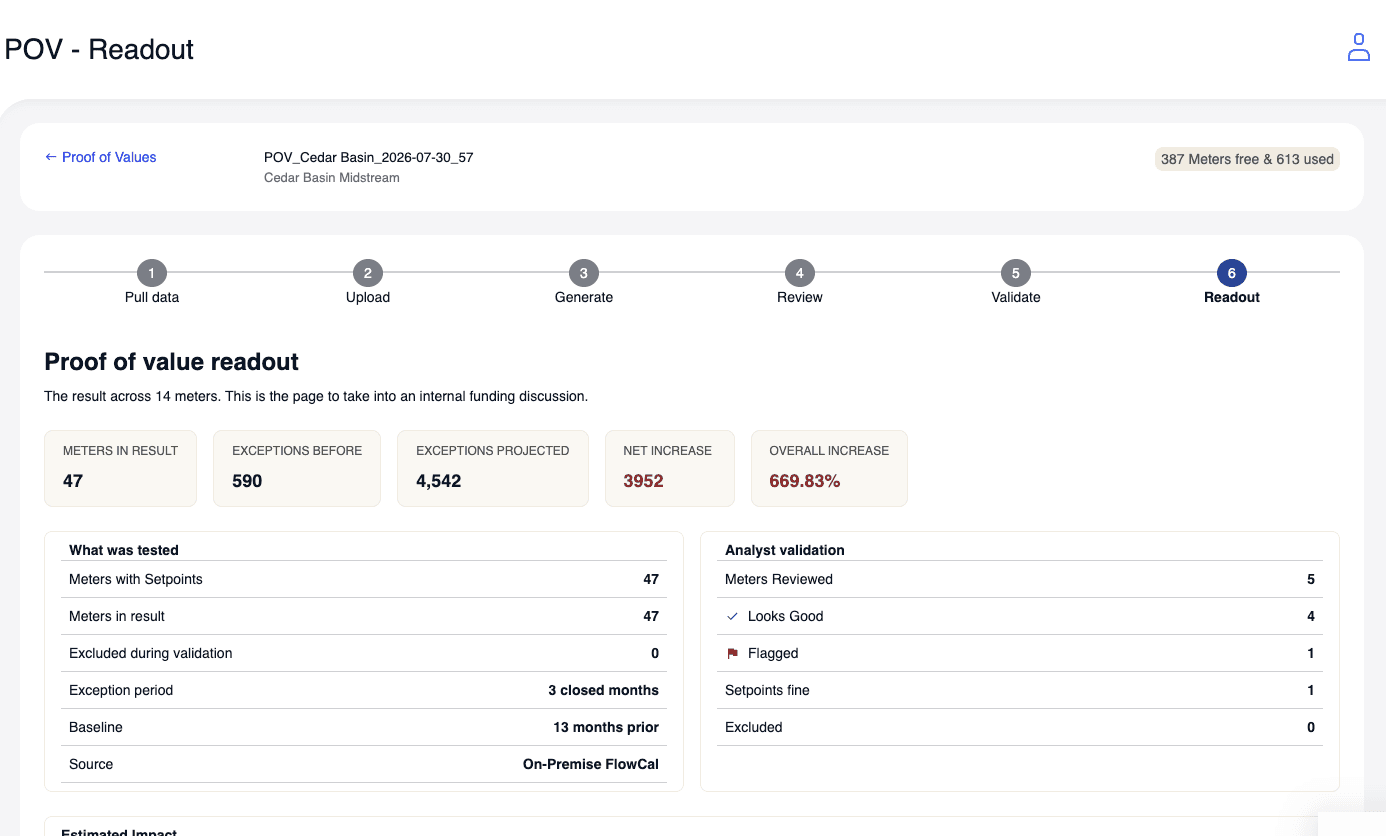
Readout
A before/after summary to share with your team.
Step 1 · Pull data
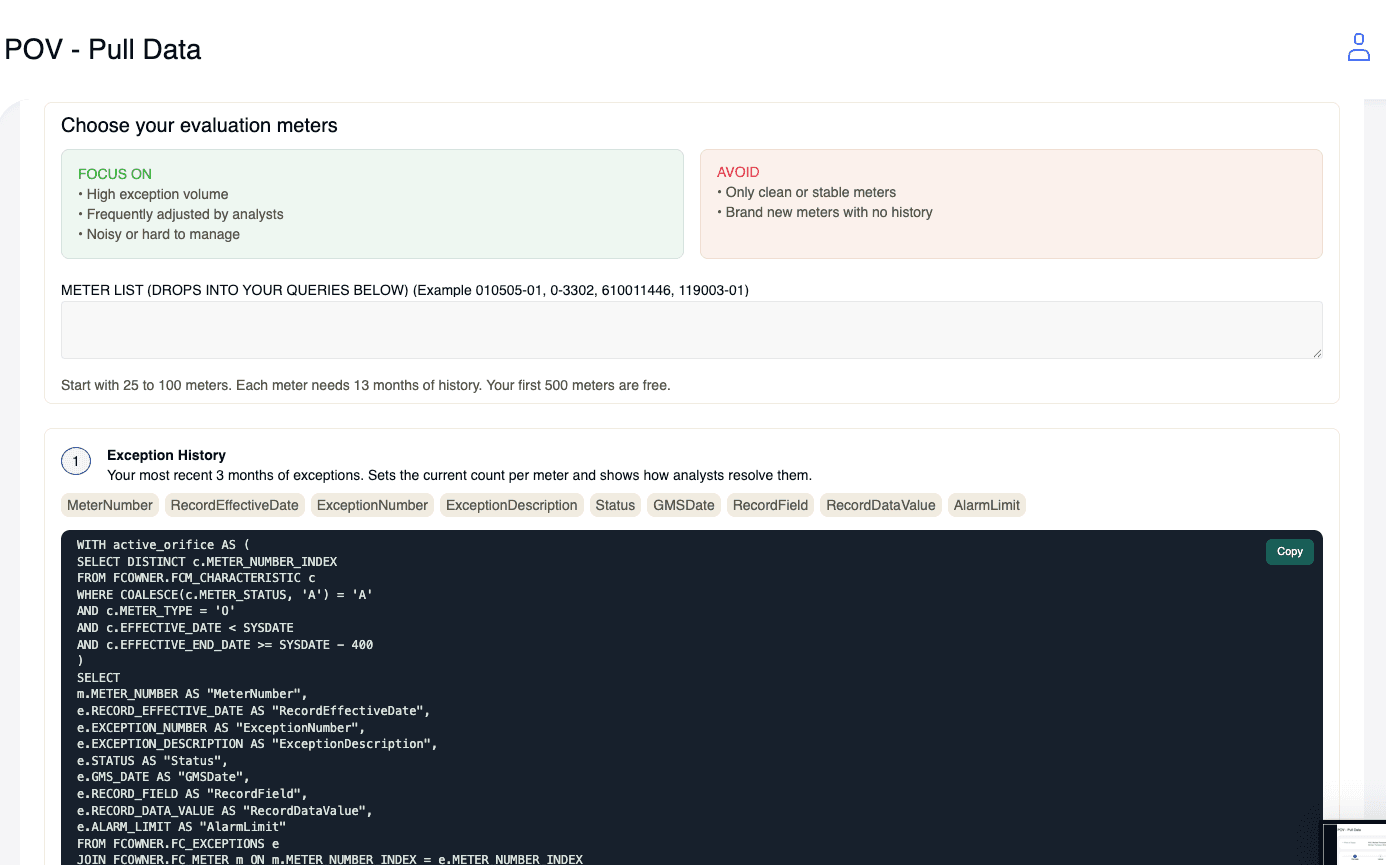
Four queries against your own FlowCal
On-premise or QCloud, Oracle or SQL Server — the queries are the same, only the connection differs. Not the person who pulls the data? Email the whole query pack to whoever is.
Step 2 · Upload
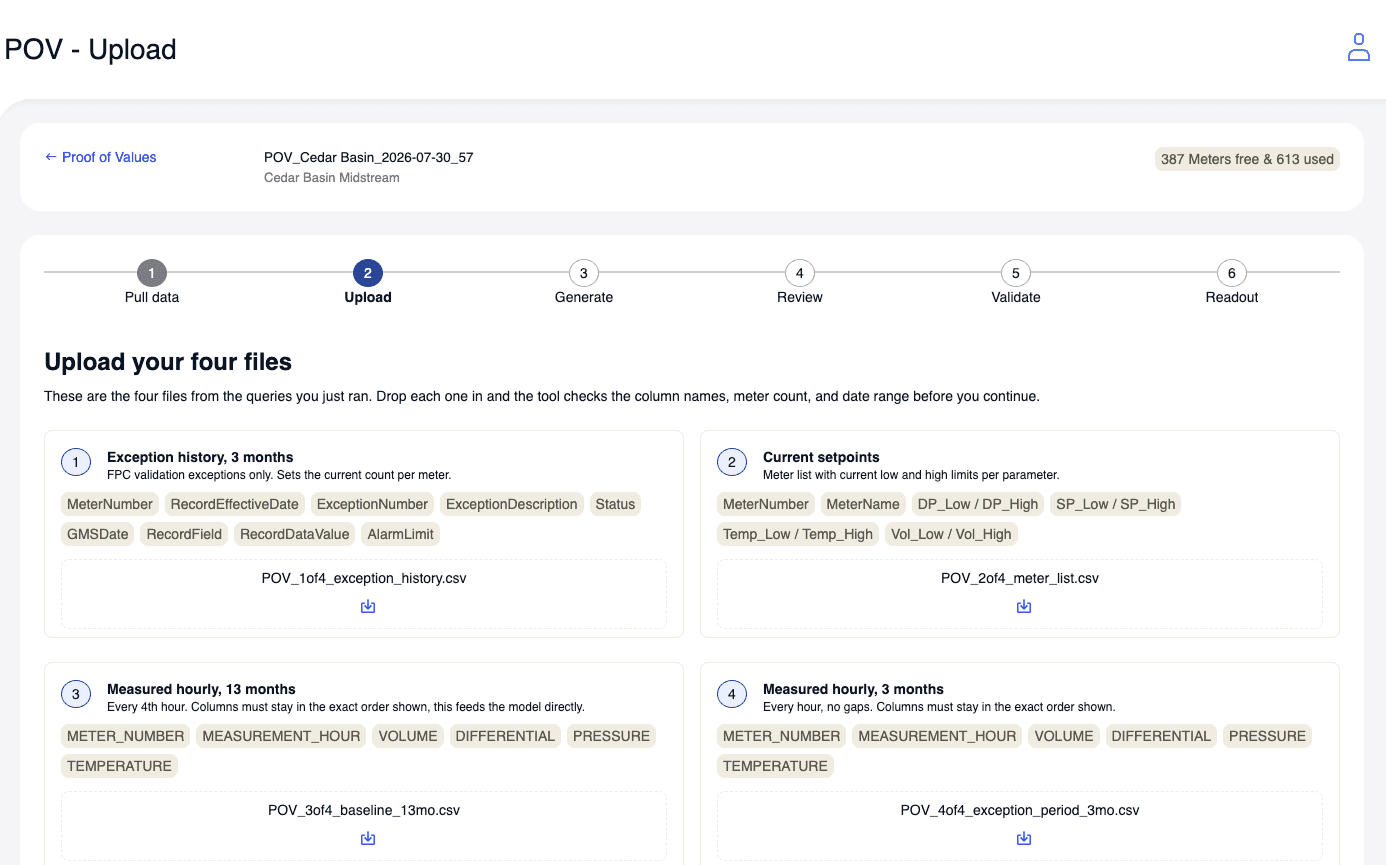
Drop in four files, we check them first
Exception history, your current setpoints, 13 months of measured hourly data, and the 3-month exception period. The tool checks column names, meter count, and date range before you continue.
Step 3 · Generate
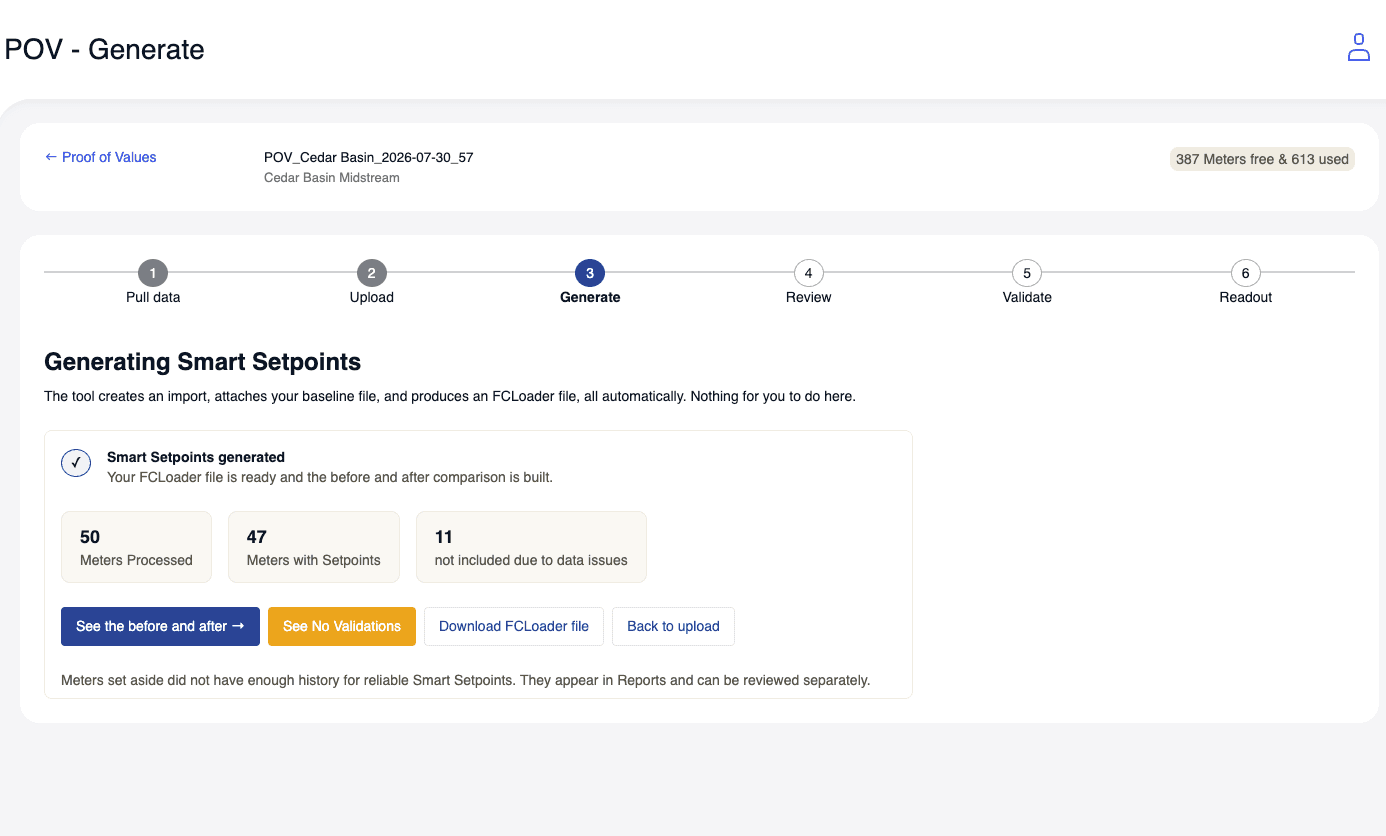
Nothing for you to do here
The tool creates the import, attaches your baseline, builds the before-and-after comparison, and produces an FCLoader file automatically.
Step 4 · Review
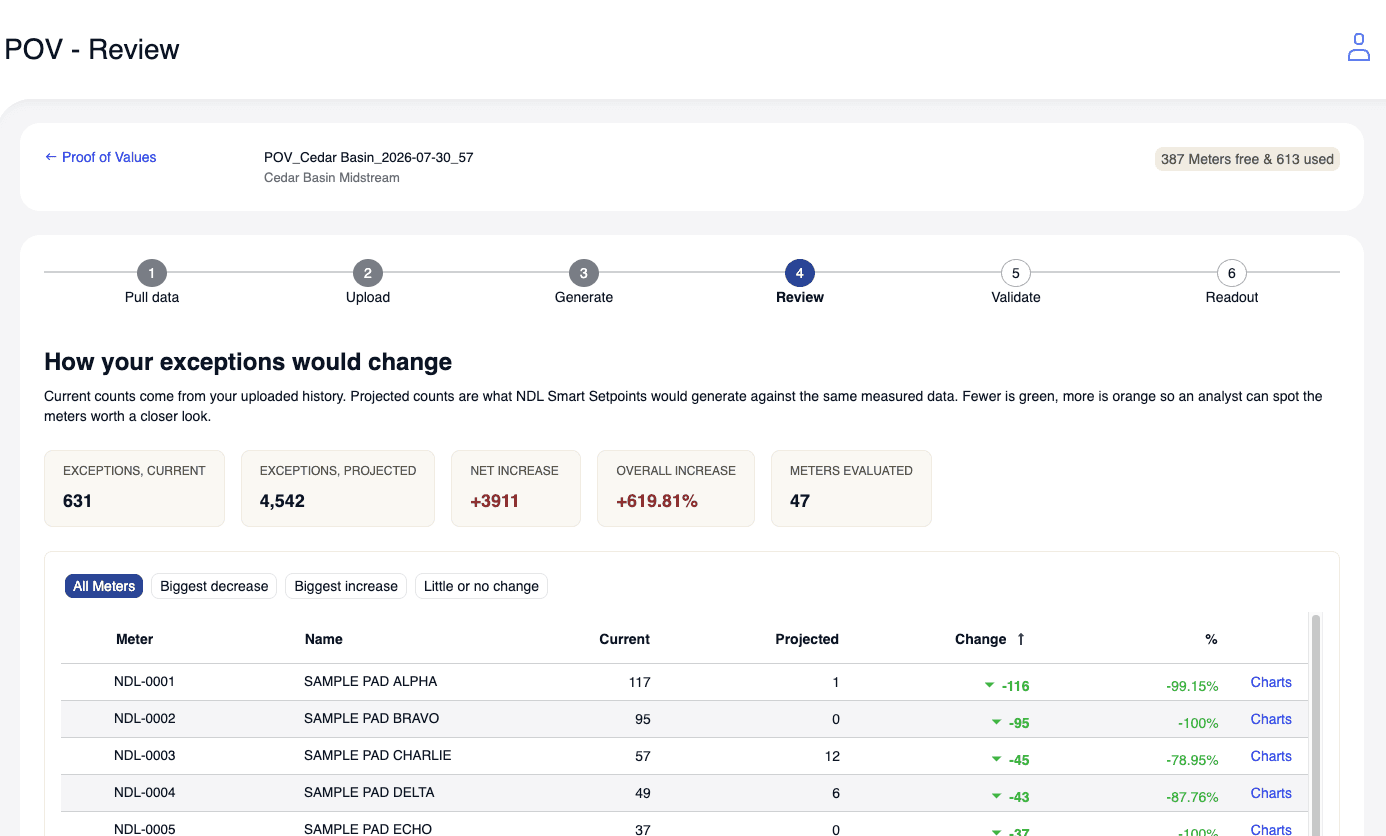
See exactly how your exceptions would change
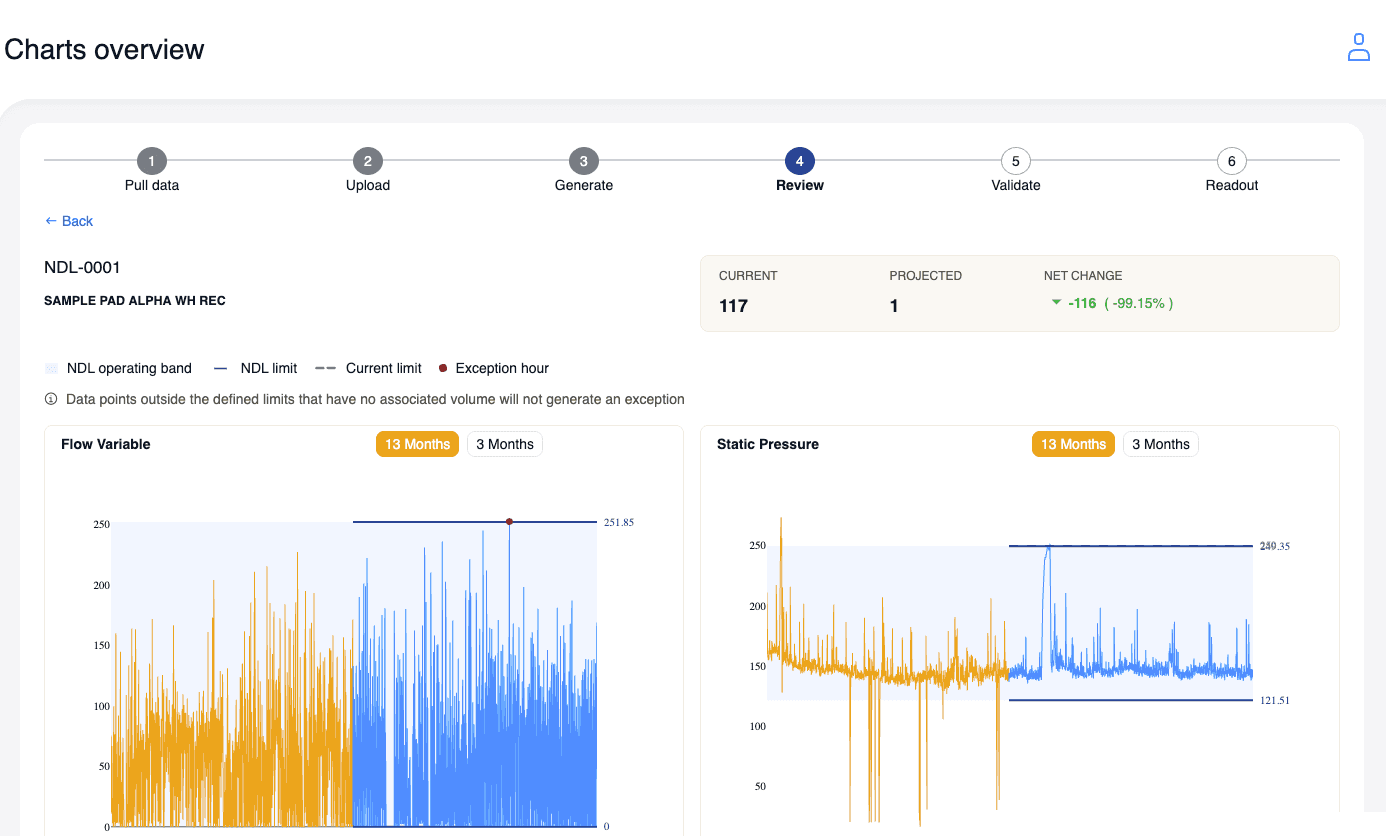
Current counts come from your uploaded history. Projected counts are what NDL setpoints would have produced against the same measured data — per meter, sortable, with charts behind every row.
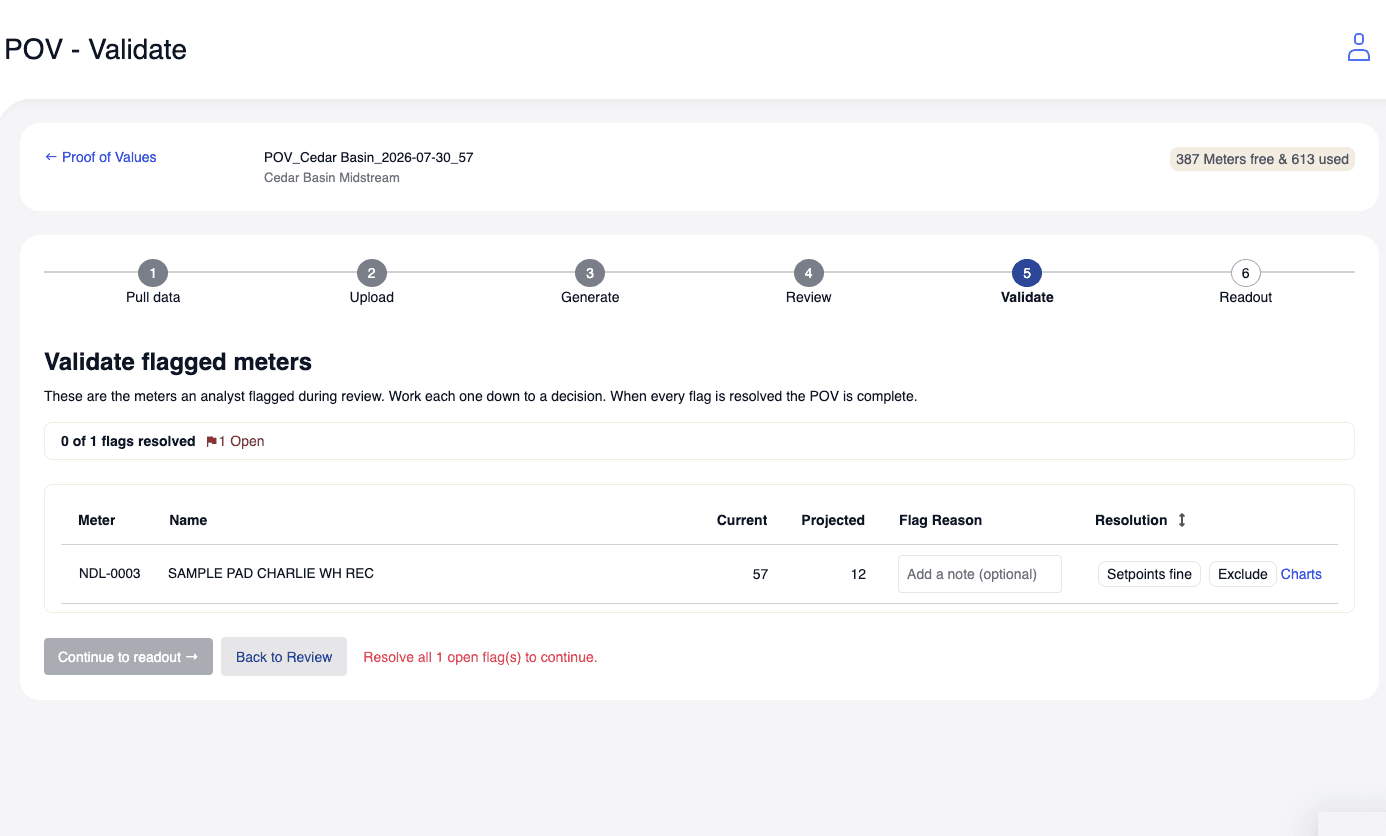
Step 5 · Validate
Work every flag down to a decision
Meters an analyst flagged during review come here. Setpoints fine, or exclude — with a note. When every flag is resolved, the POV is complete.
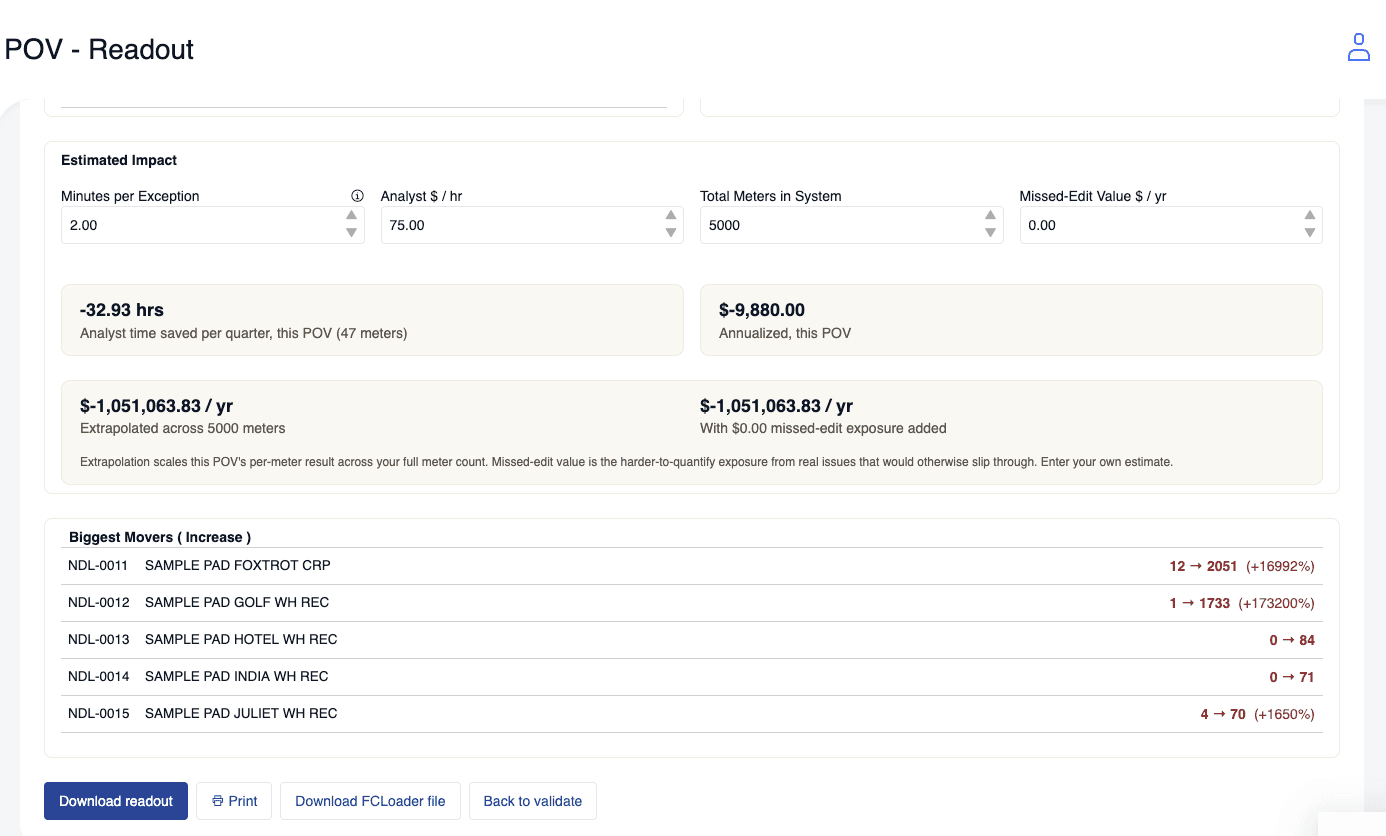
Step 6 · Readout
The page you take into a funding discussion
Meters tested, exceptions before and after, what analysts decided, and the estimated impact in hours and dollars — using your own minutes-per-exception and analyst rate, extrapolated across your full meter count.